Visualizing the Graph |
  
|
Visualizing the Graph |
|
When visualizing the graphical representation printer we will have at the center the graphical representation for the variables, below the state of the devices (outputs) and to the left side the value axes.
We have below an example of a plotted graphical representation.
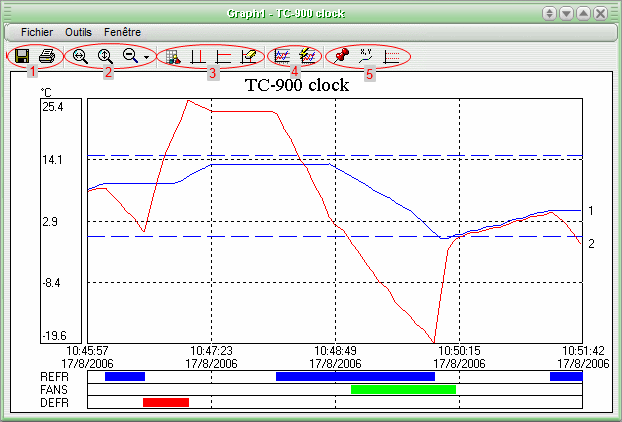
The graphical representation above shows the variation in room temperature and evaporator's temperature when measured by a TC-900clock model instrument in a determined time period.
In the tool bar of this screen we have the options to save and print the graphical representation (1), apply zoom (2), adjust the referential lines of the graphical representation (3), to refresh the data of the Graphical Representation (4) and to option of displaying the legend and coordinate (5).
See Also
URL of this page