Configuring Curves |
  
|
Configuring Curves |
|
This function allows the user to select which curves that they wish to plot on the graph. The configuration is made upon creating a new graph using the option boxes Configure Curves and Curves.
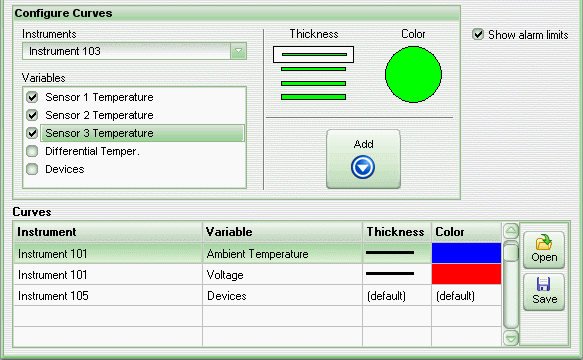
To configure a curve, follow the instructions below:
1) In the combined box Instruments, select the desired instrument;
2) In the combined box Variables, select the desired variable;
3) Select the thickness of the line of the graph clicking on the one desired;
4) Choose the color of the line of the graph clicking in the Color circle, a dialogue box will be displayed so the color can be chosen. For the first fifteen curves, the system will suggest different colors, and after that point the user should select the color. For devices, the system will use pre-defined colors, and selection will not be allowed;
6) After performing the steps above, click on the Add button, and the information for the curve will be added to the list of curves.
If you want to remove a curve, click with the right button on the mouse over the desired curve on the list of curves, and then click on the Remove button on the menu that will appear.
After adding a curve to the list, it will also be possible to change the thickness and color of the line. For that purpose, click on the respective field of the list, and a dialogue box will allow the alteration of the value.
After configuring all of the desired curves, it is possible to save this configuration clicking on the Save button. In the dialogue box that will appear, give a name to the file and then click on the button Save. The file will be saved with the extension ".cva" and may be opened at any time to plot the graph.
To open a curves file, click on the Open button and then select it through the dialogue box that will appear. The configurations of the curves will be automatically added to the list of curves.
Finally, the user may indicate, marking the option Plot limits of the alarms, the limits of the alarms will be plotted on the graph as horizontally traced lines.
To visualize the graph, click on the Create button.
Note: It is possible to add up to 256 curves into a single configuration file.
See Also
URL of this page