Referential Lines |
  
|
Referential Lines |
|
The referential lines are the broken line lines that appear in the graphical representation dividing it in quadrants, helping so in the best analysis of the values plotted in the graphical representation.
As default the graphical representation has 4 horizontal divisions (date axis) and 4 vertical divisions (value axis). In order to alter these values, click on the menu Tools and then on the submenu Grid Configuration. The screen will be shown.
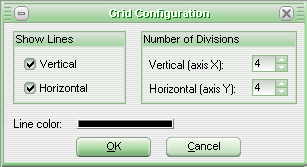
In this screen it is possible to choose which referential lines will be shown (horizontal and vertical), amount of divisions what there each axis and the referential line color. In order to alter the line's color just click on its representation.
In order to add extra referential lines to the graphical representation click on the button Insert Mark, move the mouse up to the wanted position and the click again with the mouse to fix the line at the wanted position. In order to clean the referential lines placed manually, click on the button Remove referential markings.
See Also
URL of this page