Applying a Zoom |
  
|
Applying a Zoom |
|
To insert zoom on the X axis (time period), just place the mouse over a point in the graph, click with the left button and drag it to another point to mark the desired zoom area. When the desired area is reached; let go the left mouse button and the zoom will be displayed on the X axis of the graph.
When the mouse is pressed over the graph for zoom insertion, the selection's initial and final period will be displayed on the upper right corner.
To insert zoom on the Y axis of the graph, click over the axis or on Insert Vertical Zoom button. If the graph has more than one type of scale, a submenu will be displayed with scale options, as shown in the image below.

After clicking the desired scale, the screen below will ask for the new limit values.
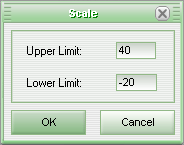
In this box, inform the limits for the new scale to be applied to the graph.
To remove zoom, access the menu item Tools, and then place the mouse over item Remove Zoom. A submenu with the items Vertical (removes Y-axis zoom), Horizontal (removes X-axis zoom), and Both (removes zoom from both axis) will appear. Click on the desired item.
Another way to apply Zoom in the Graph is resize the window dimensions. This will adjust the graph size to the window size.
See Also
URL of this page