Datalogger Control |
  
|
Datalogger Control |
|
SwitchLOG plus has an internal datalogger that keeps the phase voltage history available for later analysis.
If you want to analyze the data collected by device, just click the Load Data button in device panel. After loading the data the screen shown below will be displayed.
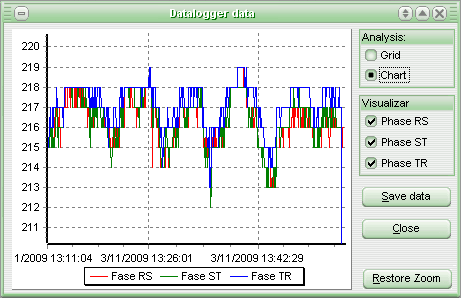
There are two viewing modes available for checking the datalogger contents. To check the data in a spreadsheet form displaying date and time, temperature value and output status for each sample, select Grid view in the Analysis data box. To check the data in a chart displayed in the screen select Chart view.
If you are analyzing the chart you can choose which variable is to be displayed in the chart by selecting the desired variable in the “View” box.
Click the Save data button to make the Sitrad import the measurement data from device to the database. After importing, the data become available for analysis through the Report Generator. It is advisable to clean the datalogger memory immediately after importing the data.
For zooming in the chart image just click with the mouse left button in the chart and drag the cursor down and to the right, framing the curve portion you want to enlarge. Then release the mouse button. To cancel the zoom just select the chart from the right to the left or click the Restore zoom button.
See Also
URL of this page