Visualizing a Text Report |
  
|
Visualizing a Text Report |
|
The figure below shows a report in the text mode.
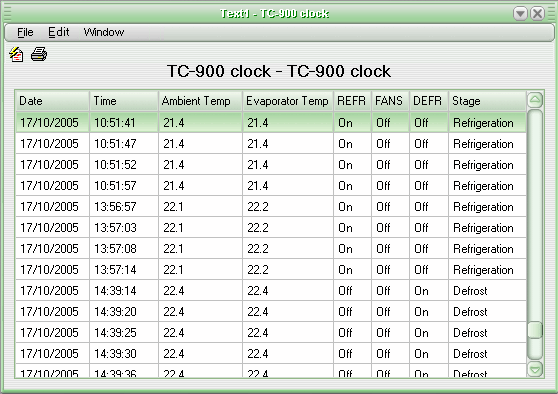
In the text mode, we can visualize the information in a more analytical fashion than the graphic mode. This report shows the date, time and value of the variables, the state of the outputs and the status of the instrument (if such is the case).
You can copy lines of information from this screen and paste them in the Excel for a better analysis. To copy the selected lines to the computer memory, open the Edit menu and choose the Copy to the Clipboard option. If you want to select all the lines from the table at once, open the Edit menu again and choose the Select All option.
See Also
URL of this page